If Rembrandt were alive today, would he still paint with oil on
canvas... or sit calmly at a desk, hand on mouse, and draw dazzling
graphics on a computer screen? Most of us would happily admit to
having less talent in both hands than a great painter like this had in a
millimeter of his pinkie, but computers can turn us into reasonably
competent, everyday artists all the same. Whether you're an architect
or a web designer, a fashion student or a scientist, computer
graphics can make your work quicker, easier, and much more
effective. How? Let's take a closer look!
Photo: Computer graphics allows us to "visualize" (imagine, mathematically) all sorts of things we can't (or won't ever) see. This image explores how the extreme gravity of two orbiting black holes distorts the light
around them. Graphics by Jeremy Schnittman and Brian P. Powell,
courtesy of NASA Goddard Space Flight Center.
Computer graphics means drawing pictures on a computer screen. What's so
good about that?
Sketch something on paper—a man or a house—and
what you have is a piece of analog information: the thing you
draw is a likeness or analogy of something in the real world.
Depending on the materials you use, changing what you draw can be
easy or hard: you can erase pencil or charcoal marks easily enough,
and you can scrape off oil paints and redo them with no trouble; but
altering watercolors or permanent markers is an awful lot more tricky.
That's the wonder of art, of course—it captures the fresh dash of
creativity—and that's exactly what we love about it. But where everyday
graphics is concerned, the immediacy of art is also a huge drawback.
What if you change your mind about where to put something or you want to swap red for orange or
green for blue?
That's why many artists, designers, and architects have fallen in love with
computer graphics. Draw a picture on a computer screen and what you
have is a piece of digital information. It probably looks
similar to what you'd have drawn on paper—the ghostly idea that was
hovering in your mind's eye to begin with—but inside the computer
your picture is stored as a series of numbers. Change the numbers and
you can change the picture, in the blink of an eye or even quicker.
It's easy to shift your picture around the screen, scale it up or
down, rotate it, swap the colors, and transform it in all kinds of
other ways. Once it's finished, you can save it, incorporate it into
a text document, print it out, upload it to a web page, or email it
to a client or work colleague—all because it's digital
information. (Find out more about the benefits of digital in our main article about
analog and digital.)
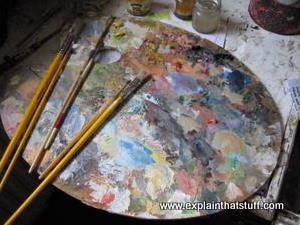
Photo: Oil paints like these can produce magical results in the right hands—but only in the right hands. Thankfully, those of us without the talent and skill to use them can still produce decent everyday art with computer
graphics.
Sponsored links
Raster and vector graphics
All computer art is digital, but there are two very different ways of
drawing digital images on a computer screen, known as raster and
vector graphics. Simple computer graphic programs like Microsoft
Paint and PaintShop Pro are based on raster graphics, while more
sophisticated programs such as CorelDRAW, AutoCAD, and Adobe
Illustrator use vector graphics. So what exactly is the difference?
Raster graphics
Stare hard at your computer screen and you'll notice the pictures and words
are made up of tiny colored dots or squares called pixels.
Most of the simple computer graphic images we come across are
pixelated in this way, just like walls are built out of
bricks. The first computer screens, developed in the mid-20th
century, worked much like televisions, which used to build up their
moving pictures by "scanning" beams of electrons (tiny charged particles inside atoms, also called
cathode rays) back and forth from top to bottom and left to
right—like a kind of instant electronic paintbrush. This way of
making a picture is called raster scanning and that's why
building up a picture on a computer screen out of pixels is called
raster graphics.
Photo: Raster graphics: This is a closeup of the paintbrushes in the photo of the artist's paint palette up above. At this magnification, you can clearly see the individual colored pixels (squares) from which the image is built, like bricks in a wall.
Bitmaps
You've probably heard of binary, the way that computers represent
decimal numbers (1,2,3,4 and so on) using just the two digits
zero and one (so the decimal number 5678 becomes 1011000101110 in
binary computer speak). Suppose you're a computer and you want to remember a
picture someone is drawing on your screen. If it's in black and
white, you could use a zero to store a white area of the picture and a
one to store a black area (or vice versa if you prefer). Copying down each pixel in turn, you could
transform a picture filling an entire screen of, say, 800 pixels
across by 600 pixels down into a list of 480,000 (800 x 600)
binary zeros and ones.
This way of turning a picture into a computer file made up of binary digits
(which are called bits for short) is called a bitmap,
because there's a direct correspondence—a one-to-one "mapping"—between
every pixel in the picture and every bit in the file. In practice, most bitmaps are
of colored pictures. If we use a single bit to represent each pixel,
we can only tell whether the pixel is on or off (white or black).
If we use (say) eight bits to represent each pixel, we can remember
256 different colors, because we can use eight binary bits to represent 256 different numbers
(2 × 2 × 2 × 2 × 2 × 2 × 2 × 2 = 256).
But we'd need eight times more
memory
(storage space inside the computer) to store a picture the same size.
The more colors we want to represent, the more bits we need.
Raster graphics are simple to use and it's easy
to see how programs that use them do their stuff. If you draw a pixel picture on your
computer screen and you click a button in your graphics package to
"mirror" the image (flip it from left to right or right to left),
all the computer does is reverse the order of the pixels by
reversing the sequence of zeros and ones that represent them. If you
scale an image so it's twice the size, the computer copies each pixel twice
over (so the numbers 10110 become 1100111100) but the image becomes
noticeably more grainy and pixelated in the process. That's one of
the main drawbacks of using raster graphics: they don't scale up to
different sizes very well. Another drawback is the amount of memory
they require. A really detailed photo might need 16 million colors,
which involves storing 24 bits per pixel and 24 times as much memory
as a basic black-and-white image. (Do the sums and you'll find that a
picture completely filling a 1024 x 768 computer monitor and using 24
bits per pixel needs roughly 2.5 megabytes of memory.)
Photo: How a raster graphics program mirrors an image. Top: The pixels in the original image are represented by zeros and ones, with black pixels represented here by 1 and white ones represented by zero. That means the top image can be stored in the computer's memory as the binary number 100111. That's an example of a very small bitmap. Bottom: Now if you ask the computer to mirror the image, it simply reverses the order of the bits in the bitmap, left to right, giving the binary number 111001, which automatically reverses the original pattern of pixels. Other transformations of the picture, such as rotation and scaling, involve swapping the bits in more complex ways.
Resolution
The maximum number of pixels in an image (or on a computer screen) is
known as its resolution. The first computer I ever used
properly, a Commodore PET, had an ultra-low resolution display
with 80 characters across by 25 lines down (so a maximum of
2000 letters, numbers, or punctuation marks could be on the screen at
any one time); since each character was built from an 8
× 8 square of pixels, that meant the screen had a resolution of 640 ×
200 = 128,000 pixels (or 0.128 Megapixels, where a Megapixel is
one million pixels). The laptop I'm using right now is set to a
resolution of 1280 × 800 =1.024 Megapixels, which is roughly 7–8 times
more detailed. A digital camera with 7
Megapixel resolution would be roughly seven times more detailed than
the resolution of my laptop screen or about 50 times more detailed
than that original Commodore PET screen.
Anti-aliasing
Displaying smoothly drawn curves on a pixelated display can produce horribly
jagged edges ("jaggies"). One solution to this is to blur the
pixels on a curve to give the appearance of a smoother line. This
technique, known as anti-aliasing, is widely used to smooth
the fonts on pixelated computer screens.
Photo: How anti-aliasing works.
Pixelated images, like the word "pixelated" shown here, are made up of individual squares or dots, which are really easy for raster graphics displays (such as LCD computer screens) to draw. I copied this image directly from the italic word "pixelated" in the text up above. If you've not altered your screen colors, the original tiny text probably looks black and very smooth to your eyes. But in this magnified image, you'll see the letters are actually very jagged and made up of many colors. If you move back from your screen, or squint at the magnified word, you'll see the pixels and colors disappear back into a smooth black-and-white image. This is an example of anti-aliasing, a technique used to make pixelated words and other shapes smoother and easier for our eyes to process.
Vector graphics
There's an alternative method of computer graphics that gets around the
problems of raster graphics. Instead of building up a picture out of pixels, you draw it
a bit like a child would by using simple straight and curved lines
called vectors or basic shapes (circles,
curves, triangles, and so on) known as primitives. With raster
graphics, you make a drawing of a house by building it from
hundreds, thousands, or millions of individual pixels; importantly,
each pixel has no connection to any other pixel except in your brain.
With vector graphics, you might draw a rectangle for the basic house,
smaller rectangles for the windows and door, a cylinder for the
smokestack, and a polygon for the roof. Staring at the screen, a
vector-graphic house still seems to be drawn out of pixels, but now
the pixels are precisely related to one another—they're points along
the various lines or other shapes you've drawn.
Artwork: Drawing using vector graphics. Here, I'm using a graphics format called SVG to draw three colored circles inside a yellow square. Instead of drawing the objects on the screen with my mouse, I "program" them using what look like simple lines of computer code. The first line draws the yellow square as a background. The next three lines draw the blue, green, and red circles. The values in "cx" and "cy" specify the x and y coordinates of each circle and "r" is its radius. I use a black "stroke" to give each circle an outline. I can make the circles bigger or smaller or position them elsewhere by adjusting the appropriate numerical values.
Drawing with straight lines and curves instead of individual dots means you can produce an
image more quickly and store it with less information: you could describe a
vector-drawn house as "two red triangles and a red rectangle
(the roof) sitting on a brown rectangle (the main building)," but you couldn't summarize a
pixelated image so simply. It's also much easier to scale a
vector-graphic image up and down by applying mathematical formulas
called algorithms that transform the vectors from which your image is drawn. That's how
computer programs can scale fonts to different sizes without making them look all pixelated and grainy.
Photo: Vector graphics: Drawing with Bézier curves ("paths") in the GIMP. You simply plot two
points and then bend the line running between them however you want to create any curve you like.
Most modern computer graphics packages let you draw an image using a
mixture of raster or vector graphics, as you wish, because sometimes
one approach works better than another—and sometimes you need to mix
both types of graphics in a single image. With a graphics package
such as the GIMP (GNU Image Manipulation Program), you can draw
curves on screen by tracing out and then filling in "paths"
(technically known as Bézier curves) before converting them into pixels ("rasterizing"
them) to incorporate them into something like a bitmap image.
3D graphics
Real life isn't like a computer game or a virtual reality simulation. The
very best CGI (computer-generated imagery) animations are
easy to tell apart from ones made on film or video with real
actors. Why is that? When we look at objects in the world around us,
they don't appear to be drawn from either pixels or vectors. In the
blink of an eye, our brains gather much more information from the
real-world than artists can include in even the most realistic
computer-graphic images. To make a computerized image look anything
like as realistic as a photograph (let alone a real-world scene), we
need to include far more than simply millions of colored-in pixels.
Really sophisticated computer graphics programs use a whole series of
techniques to make hand-drawn (and often completely imaginary)
two-dimensional images look at least as realistic as photographs. The simplest way of achieving this is to
rely on the same tricks that artists have always used—such things as
perspective (how objects recede into the distance toward a
"vanishing point" on the horizon) and hidden-surface
elimination (where nearby things partly obscure ones that are
further away).
If you want realistic 3D artwork for such things as CAD (computer-aided design)
and virtual reality, you need much more
sophisticated graphic techniques. Rather than drawing an object, you
make a 3D computer model of it inside the computer and
manipulate it on the screen in various ways. First, you build up
a basic three-dimensional outline of the object called a wire-frame
(because it's drawn from vectors that look like they could be little
metal wires). Then the model is rigged, a process in which
different bits of the object are linked together a bit like the bones
in a skeleton so they move together in a realistic way. Finally, the
object is rendered, which involves shading the outside parts
with different textures (surface patterns), colors, degrees of
opacity or transparency, and so on. Rendering is a hugely complex
process that can take a powerful computer hours, days, or even weeks
to complete. Sophisticated math is used to model how light falls on
the surface, typically using either ray tracing (a relatively
simple method of plotting how light bounces off the surface of shiny
objects in straight lines) or radiosity (a more sophisticated
method for modeling how everyday objects reflect and scatter light
in duller, more complex ways).
Photo: NASA scientists think computer graphics will one day be so good that
computer screens will replace the cockpit windows in airplanes.
Instead of looking at a real view, the pilots will be shown a computerized image drawn from sensors
that work at day or night in all weather conditions. For now, that remains a science fiction dream, because even well-drawn "3D" computer images like this are easy to tell from photographs of real-world scenes: they simply don't contain enough information to fool our amazingly fantastic eyes and brains. Photo courtesy of
NASA Glenn.
What is computer graphics used for?
Obvious uses of computer graphics include computer art, CGI films,
architectural drawings, and graphic design—but there are many
non-obvious uses as well and not all of them are "artistic."
Scientific visualization is a way of producing graphic output
from computer models so it's easier for people to understand.
Computerized models of global warming produce vast tables of numbers
as their output, which only a PhD in climate science could figure
out; but if you produce a speeded-up animated visualization—with the
Earth getting bluer as it gets colder and redder as it gets
hotter—anyone can understand what's going on. Medical imaging
is another good example of how graphics make computer data more
meaningful. When doctors show you a brain or body scan, you're
looking at a computer graphic representation drawn using vast amounts
of data produced from thousands or perhaps even millions of
measurements. The jaw-dropping photos beamed back from space by
amazing devices like the Hubble Space Telescope are usually enhanced
with the help of a type of computer graphics called image
processing; that might sound complex, but it's not so very
different from using a graphics package like PhotoShop to touch up your holiday snaps).
Photo: Computer graphics can save lives. Medical scan images are often complex computerized
images built up from hundreds or thousands of detailed measurements of the human body or (as shown here) brain. Image by Govind Bhagavatheeshwaran and Daniel Reich courtesy of National Institutes of Health.
And that's really the key point about computer graphics: they turn
complex computer science into everyday art we can all grasp,
instantly and intuitively. Back in the 1980s when I was programming a
Commodore PET, the only way to get it to do anything was to type
meaningless little words like PEEK and POKE onto a horribly unfriendly green and black screen.
Virtually every modern computer now has what's called a GUI
(graphical user interface), which means you operate the machine by pointing at things you
want, clicking on them with your mouse or your finger, or dragging them
around your "desktop." It makes so much more sense because we're visual creatures:
something like a third of our cortex (higher brain) is given over to
processing information that enters our heads through our eyes. That's
why a picture really is worth a thousand words (sometimes many more)
and why computers that help us visualize things with computer
graphics have truly revolutionized the way we see the world.
What is computer-aided design (CAD)?
Photo: Designing a plane? CAD makes it quicker and easier to transfer what's in your mind's eye into reality. Graphics by Ethan Baumann courtesy of NASA.
Computer-aided design (CAD)—designing things on a computer screen instead of on paper—might sound hi-tech and modern, but it's been in use now for over a half century. It first appeared back in 1959, when IBM and General Motors developed Design Augmented by Computers-1 (DAC-1), the first ever CAD system, for creating automobiles on a computer screen.
Drawing on a computer screen with a graphics package is a whole lot easier than sketching on paper,
because you can modify your design really easily. But that's not all there is to CAD.
Instead of producing a static, two-dimensional (2D) picture, usually
what you create on the screen is a three-dimensional (3D) computer
model, drawn using vector graphics and based on a
kind of line-drawn skeleton called a wireframe, which looks a
bit like an object wrapped in graph paper.
Once the outside of the model's done, you turn your attention to its inner structure.
This bit is called rigging your model (also known as skeletal animation).
What parts does the object contain and how do they all connect together?
When you've specified both the inside and outside details, your model is pretty
much complete. The final stage is called texturing, and
involves figuring out what colors, surface patterns,
finishes, and other details you want your object to have: think of
it as a kind of elaborate, three-dimensional coloring-in. When your
model is complete, you can render it: turn it into a
final image. Ironically, the picture you create at this stage may look like it's
simply been drawn right there on the paper: it looks exactly like any
other 3D drawing. But, unlike with an ordinary drawing, it's super-easy to change things: you can modify
your model in any number of different ways. The computer can rotate
it through any angle, zoom in on different bits, or even help you
"cutaway" certain parts (maybe to reveal the engine inside a plane) or "explode" them (show how they break into
their component pieces).
Graphics: CAD drawing of a hyper-X plane courtesy of NASA Langley Research Center (NASA-LaRC).
What is CAD used for?
From false teeth to supercars and designer dresses to drink cartons, virtually every
product we buy today is put together with the help of computer-aided
design. Architects, advertising and marketing people, draftsmen,
car designers, shipbuilders, and aerospace engineers—these are just
some of the people who rely on CAD. Apart from being cheaper and
easier than using paper, CAD designs are easy to send round the world
by email (from designers in Paris to manufacturers in Singapore,
perhaps). Another big advantage is that CAD drawings can be converted
automatically into production instructions for industrial robots and
other factory machines, which greatly reduces the overall time needed to turn
new designs into finished products. Next time you buy something from
a store, trace it back in your mind's eye: how did it find its way
into your hand, from the head-scratching designer sitting at a
computer in Manhattan to the robot-packed factory in Shanghai where
it rolled off the production line? Chances are it was all done with
CAD!
Using CAD in architecture
Architects have always been visionaries—and they helped to pioneer the adoption of CAD technology from the mid-1980s, when easy-to-use desktop publishing computers like the Apple Mac became widely available. Before CAD came along, technical drawing, was the best solution to a maddening problem architects and engineers knew only too well: how to communicate the amazing three-dimensional constructions they could visualize in their mind's eye with clarity and precision. Even with three-dimensional drawings (such as orthographic projections), it can still be hard to get across exactly what you have in mind. What if you spent hours drawing your proposed building, airplane, or family car... only for someone to say infuriating things like: "And what does it look like from behind? How would it look from over there? What if we made that wall twice the size?" Having drawn their projections, architects would typically build
little models out of paper and board, while engineers would whittle model cars and planes out of balsa wood.
But even the best models can't answer "What if...?" questions.
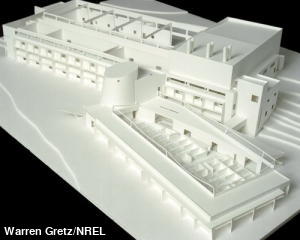
Photo: Architectural models are traditionally made from paper or cardboard, but they're laborious and expensive to make, fragile and difficult to transport, and virtually impossible to modify. Computer models don't suffer from any of these drawbacks. Photo by Warren Gretz courtesy of US DOE/NREL.
Computer-aided design solves these problems in a particularly subtle way. It doesn't simply
involve drawing 2D pictures of buildings on the screen: what you produce with CAD is effectively a
computer model of your design. Once that's done, it's easy to rotate your design on-screen or change any aspect of it in a matter of moments. If you want to make a wall twice the size, click a button, drag your mouse here and there, and the computer automatically recalculates how the rest of your model needs to change to fit in. You can print out three dimensional projections of your model from any angle or you can demonstrate the 3D form to your clients on-screen, allowing them to rotate or play with the model for themselves. Some models even let you walk through them in virtual reality. CAD has revolutionized
architecture not simply by removing the drudge of repetitive plan drawing and intricate model making, but by providing a
tangible, digital representation of the mind's eye: what you see is—finally—what you get.
Over the last 30 years, computers have absolutely revolutionized architecture. In 2012, Architects' Journal went so far as to describe CAD as "the greatest advance in construction history."
Who invented computer graphics?
Here's a brief timeline of some key moments in the history of computer graphics. In this section, most links will
take you to Wikipedia articles about the pioneering people and programs.
The beginnings
1951:
Jay Forrester and Robert Everett of Massachusetts Institute of
Technology (MIT) produce Whirlwind, a mainframe computer that can display crude images on a television monitor or VDU (visual display unit).
1955: Directly descended from Whirlwind, MIT's SAGE (Semi-Automatic Ground Equipment) computer uses simple vector graphics to display
radar images and becomes a key part of the US missile defense system.
1959: General Motors and IBM develop Design Augmented by Computers-1 (DAC-1), a CAD (computer-aided design) system to help engineers design cars.
1961: John Whitney, Sr. uses computer graphics to design a captivating title sequence for the Alfred Hitchcock thriller Vertigo.
1961:
MIT student Steve Russell programs Spacewar!, the first graphical
computer game, on a DEC PDP-1 minicomputer.
1963: Ivan Sutherland, a pioneer of human-computer interaction (making computers intuitively easy for humans to use), develops Sketchpad
(also called Robot Draftsman), one of the first computer-aided
design packages, in which images can be drawn on the screen using a
lightpen (an electronic pen/stylus wired into the computer). Later,
Sutherland develops virtual reality equipment and flight simulators.
1965: Howard Wise holds an exhibition of computer-drawn art at his pioneering gallery in Manhattan, New York.
1966: NASA's Jet Propulsion Laboratory (JPL) develops an image-processing
program called VICAR (Video Image Communication and Retrieval),
running on IBM mainframes, to process images of the moon captured by
spacecraft.
1970: Bézier curves are developed, soon
becoming an indispensable tool in vector graphics.
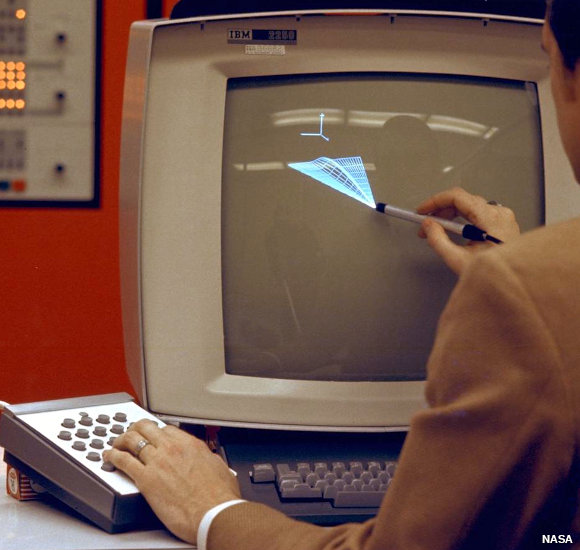
Photo: A NASA scientist draws a graphic image on an IBM 2250 computer screen with a light pen. This
was state-of-the-art technology in the 1970s! Photo by courtesy of NASA Ames Research Center (NASA-ARC).
Computer graphics for everyone
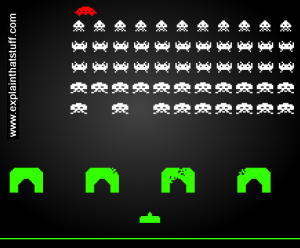
Photo: Computer graphics, early 1980s style! Arcade games like Space Invaders were how most 40- and 50-something computer geeks first experienced computer graphics. At that time, even good computer screens could display only about 64,000 pixels—hence the relatively crudely drawn, pixelated graphics.
1972: Atari releases PONG, a popular version of ping-pong (table tennis)
played by one or two players on a computer screen.
1973: Richard Shoup produces SuperPaint, a forerunner of modern computer graphic packages, at the Xerox PARC (Palto Alto Research Center) laboratory.
1970s: Ivan Sutherland's student Edwin Catmull becomes one of the pioneers of 3D computer-graphic animation, later playing key roles at Lucasfilm, Pixar, and Disney.
1981: UK company Quantel develops Paintbox, a revolutionary
computer-graphic program that allows TV producers and filmakers to
edit and manipulate video images digitally.
1982: The movie Tron, starring Jeff Bridges, mixes live action and
computer graphic imagery in a story that takes a man deep inside a computer system.
1980s: The appearance of the affordable, easy-to-use Apple Macintosh computer paves the way for desktop publishing (designing things on
your own small office computer) with popular computer graphic
packages such as Aldus PageMaker (1985) and QuarkXPress (1987).
1985: Microsoft releases the first version of a basic raster-graphics drawing program called
MS Paint.
Thanks to its stripped-down simplicity, it becomes one of the world's most popular computer art programs.
1990: The first version of Adobe PhotoShop (one of the world's most
popular professional graphic design packages) is released. A simple,
affordable home graphics program called PaintShop (later PaintShop
Pro) is launched the same year.
1993: University of Illinois student Marc Andreessen develops Mosaic, the first web browser to show text and images side-by-side, prompting a huge explosion in
interest in the Web virtually overnight.
1995: Toy Story, produced by Pixar Animation Studios (founded by
Apple's Steve Jobs, with Ed Catmull as its chief technology officer)
demonstrates the impressive possibilities of CGI graphics in
moviemaking. Stunning follow-up movies from the same stable include
A Bug's Life, Monsters, Inc., Finding Nemo, and
The Incredibles.
1995: The GIMP (GNU Image Manipulation Program) is developed by University of California students Spencer Kimball and Peter Mattis as an open-source alternative to PhotoShop..
1999: The World Wide Web Consortium (W3C) begins development of SVG (Scalable Vector Graphics), a way of using text-based (XML) files to provide higher-quality images on the Web. SVG images can include elements of both conventional vector and raster graphics.
2017: Microsoft announces it will not kill off its basic but very popular Paint program,
loved by computer artists for over 30 years.
2021: Facebook unveils plans for a new, interactive work and play space called the Metaverse. Will we live much of our future life in a computer-graphic virtual world?
ACM SIGGRAPH: Worldwide conference for computer graphics professionals held annually since 1974. (The acronym stands for the Association for Computing Machinery's Special Interest Group on Computer Graphics and Interactive Techniques.)
Books
General
Computer Graphics: Principles and Practice by John F. Hughes, Andries van Dam, et al. Addison-Wesley Professional, 2014. Classic introductory textbook, now in its third edition.
Computer Graphics: Theory and Practice by Jonas Gomes et al. CRC Press, 2012. A relatively accessible up-to-date introduction, with less complex math than some of the other basic texts.
Computer Graphics: Theory into Practice by Jeffrey J. McConnell. Jones and Bartlett, 2006. A much more theoretical and abstract approach to computer graphics that takes the human visual system as its starting point: if you know how our eyes work, you can produce more effective graphics.
3D Computer Graphics by Alan Watt. Addison-Wesley, 2000. Introduces 3D graphics for computer-aided design and the Web.
CAD
AutoCAD for Dummies by Bill Fane. John Wiley & Sons, 2019. How to create and annotate technical drawings and models with AutoCAD.
AutoCAD: Professional Tips and Techniques by Lynn Allen and Scott Onstott. Addison-Wesley, 2007. Hands-on introduction to one of the industry-standard CAD packages.
Computer-Aided Design by Dean L. Taylor. Addison-Wesley, 1992. Quite old new, but still a comprehensive overview and a good introduction to the basic concepts.
Articles
The Real Story of Pixar by Alvy Ray Smith, IEEE Spectrum, 3 Aug 2021. A look behind the scenes at the CGI pioneers.
Chip Hall of Fame: Nvidia NV20 by Katherine Bourzac. IEEE Spectrum, 2 July 2018.
Celebrating the classic graphics processor chip from 2001.
Behold, the World's Most Famous Teapot by David C. Brock. IEEE Spectrum, 25 October 2017. How an exercise in mathematical modeling became a computer graphics icon.
Motion Capture Technology Goes Into the Wild for Dawn of the Planet of the Apes by Tekla Perry. IEEE Spectrum, 10 July 2014. Motion capture helps computer graphic artists to draw movement more realistically by "tracking" the motion of a real, human actor. Here's how it worked on a typical movie, Dawn of Planet of the Apes.
GrabCAD Is Building Community in 3-D by Sarah Mitroff, Wired, 15 October 2012. A brief look at GrabCAD, a kind of Github for engineers and CAD designers.
Please do NOT copy our articles onto blogs and other websites
Articles from this website are registered at the US Copyright Office. Copying or otherwise using registered works without permission, removing this or other copyright notices, and/or infringing related rights could make you liable to severe civil or criminal penalties.